Home Prices Rise
“A house with love in it is rich indeed.” Nat King Cole. Families may find themselves living on love as they invest more on increasing home prices. 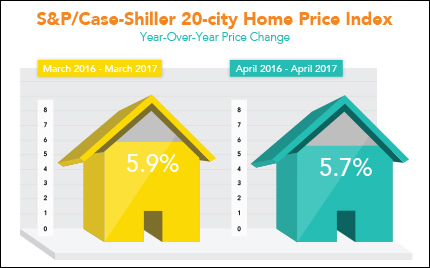
The S&P/Case-Shiller 20-City Home Price Index saw another gain of 5.7 percent from April 2016 to April 2017. Price increases are due in part to limited supply of housing in many areas across the nation. Plus, low home loan rates are inspiring people to purchase homes or upgrade their homes, taxing limited inventory.
The overall economy performed better than previously reported in the first quarter of 2017, according to the Commerce Department. The final read on first quarter Gross Domestic Product came in at 1.4 percent, above the second read of 1.2 percent, and well above the first read of 0.7 percent. Consumer spending, which accounts for nearly two-thirds of all economic activity, got a nice boost, rising 1.1 percent from 0.6 percent, though this is still a low level.
Consumer inflation remained tame in May, as the Core Personal Consumption Expenditures (PCE) was in line with expectations at 0.1 percent. The Core PCE reading excludes volatile food and energy costs. Year over year, Core PCE fell to 1.4 percent, well below the Fed’s target range of 2 percent. Inflationary pressures can reduce the value of fixed investments like Mortgage Bonds and worsen the home loan rates tied to them.
At this time, despite a volatile week in the markets, home loan rates remain just above historic lows.
Forecast for the Week:
The Jobs Report could launch fireworks in an otherwise quieter week. Stock markets close at 1:00 p.m. ET and Bond markets at 2:00 p.m. ET, Monday, July 3. Markets will be closed Tuesday for the July 4th holiday.
- The ISM Index will be released on Monday followed by the ISM Services Index Thursday.
- Though not an economic report, the June Federal Open Market Committee (FOMC) meeting minutes will be released Wednesday and could spur volatility.
- The onslaught of employment data begins Thursday with the ADP National Employment Report and weekly Initial Jobless Claims.
- Look for the June Jobs Report on Friday, which includes Non-farm Payrolls, the Unemployment Rate and Hourly Earnings.
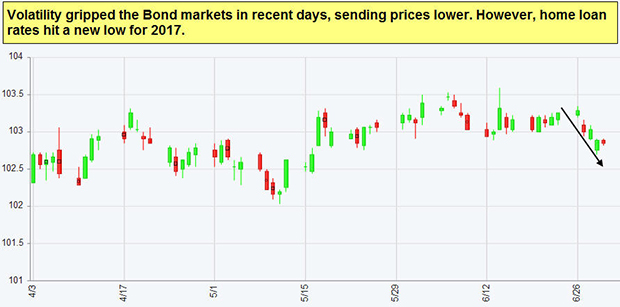
Remember: Weak economic news normally causes money to flow out of Stocks and into Bonds, helping Bonds and home loan rates improve. In contrast, strong economic news normally has the opposite result. The chart below shows Mortgage Backed Securities (MBS), which are the type of Bond on which home loan rates are based.
When you see these Bond prices moving higher, it means home loan rates are improving. When Bond prices are moving lower, home loan rates are getting worse.
To go one step further, a red “candle” means that MBS worsened during the day, while a green “candle” means MBS improved during the day. Depending on how dramatic the changes are on any given day, this can cause rate changes throughout the day, as well as on the rate sheets we start with each morning.
As you can see in the chart below, Mortgage Bonds lost ground in recent days heading into what should be a quiet holiday trading week.
Source: http://www.mmgweekly.com