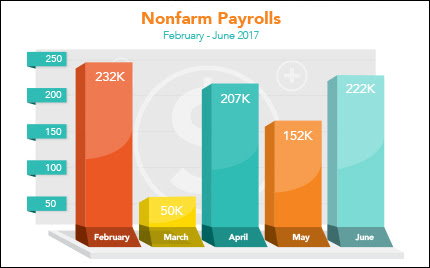
Job Growth Soars in June
“Let’s work, be proud. Stand tall, touch the clouds.” Mick Jagger. More Americans were headed to work, but take-home pay stayed about the same.
Employers added 222,000 new jobs in June, well above expectations, the Labor Department reported. April was revised up from 174,000 to 207,000, and May was revised up from 138,000 to 152,000 jobs. With these revisions, employment gains in April and May combined were 47,000 more than previously reported. The unemployment rate was little changed at 4.4 percent. Employment growth has averaged 180,000 per month in 2017, in line with the average monthly gain of 187,000 jobs in 2016.
However, average hourly earnings showed just a 0.2 percent gain from May and 2.5 percent gain year over year. May’s reading was revised lower to just 0.1 percent.
Also of note, the minutes from the June Federal Open Market Committee (FOMC) meeting were released. While investors were looking for a signal to when the Fed might start trimming its $4 trillion balance sheet, the minutes showed a divided group on the timing. Mixed economic growth and tame inflation remained central to FOMC discussions as the committee crafted monetary policy. Strong economic news and rising inflation can negatively impact Bond prices and the home loan rates tied to them.
A big market mover this week came courtesy of the Fed’s equivalent overseas, the European Central Bank. Positive economic outlook catapulted yields in Europe.
For now, home loan rates here at home remain in attractive territory.
Forecast for review:
Inflation and Retail Sales numbers are the ones to watch.
- Although not an economic report, the Fed’s Beige Book releases Wednesday, giving anecdotal information on business and economic conditions across the country.
- Thursday brings wholesale inflation via the Producer Price Index as well as the usual weekly Initial Jobless Claims.
- The Consumer Price Index, Retail Sales and Consumer Sentiment Index are scheduled for Friday.
Remember: Weak economic news normally causes money to flow out of Stocks and into Bonds, helping Bonds and home loan rates improve. In contrast, strong economic news normally has the opposite result. The chart below shows Mortgage Backed Securities (MBS), which are the type of Bond on which home loan rates are based.
When you see these Bond prices moving higher, it means home loan rates are improving. When Bond prices are moving lower, home loan rates are getting worse.
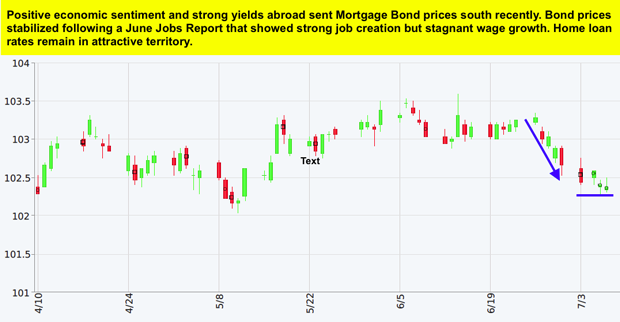
To go one step further, a red “candle” means that MBS worsened during the day, while a green “candle” means MBS improved during the day. Depending on how dramatic the changes are on any given day, this can cause rate changes throughout the day, as well as on the rate sheets we start with each morning.
As you can see in the chart below, Mortgage Bonds buckled under some pressure from positive economic news out of the European Central Bank recently. Home loan rates remain attractive.
Chart: Fannie Mae 3.5%% Mortgage Bond (Jul 07, 2017)
Source: mmgWeekly