MMG Weekly: Report Card in for 2016 Housing, GDP
 Last Week in Review
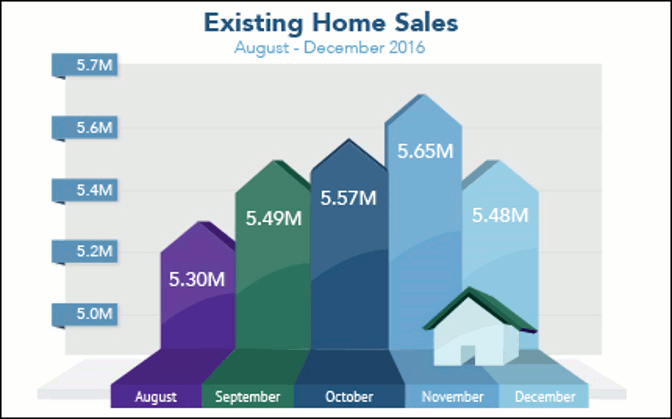
“Turn this house into a home.” Luther Vandross. Existing Home Sales and New Home Sales followed a similar path downward in December. But the latest housing reports still had good news to share.
Existing Home Sales closed out 2016 as the best year in a decade, though December’s numbers were below expectations at 5.48 million units on an annualized basis. The National Association of REALTORS® reported that sales in 2016 were 5.45 million units, above the 5.25 million in 2015 and the highest since the 6.48 million in 2006.
New Home Sales fell 10.4 percent from November to December. It was the lowest level since February 2015 and down 0.4 percent from December 2015. Although the news was disappointing, data showed a near six-month supply of new homes for sale, which finally signals a healthy balance between supply and demand.
These reports suggest a strengthening job market may have put potential homebuyers and sellers at ease this past year.
Weaker-than-expected economic growth in the final quarter of 2016 came as a surprise. The Bureau of Economic Analysis reported that Gross Domestic Product (GDP) grew by 1.9 percent in the final quarter of 2016, below the 2.2 percent expected and down from the 3.5 percent reported in the third quarter. For all of 2016, GDP grew by a tepid 1.9 percent, down from 2.6 percent in 2015 and at its worst level since 2011. On a positive note, within the report it showed that consumer spending rose 2.5 percent.
The disappointing GDP numbers did give Mortgage Bonds a slight boost, which was a welcome change from the declines experienced throughout January. When Bonds improve, the home loan rates that are tied to them can improve as well. The reverse is also true.
For now, home loan rates remain in attractive territory.
If you or someone you know has any questions about current home loan rates or products, please don’t hesitate to contact me.
Forecast for the Week
In a week fully loaded with economic news, employment data and monetary policy will command attention.
· Monday kicks off with Personal Income, Personal Spending and the Fed’s favorite inflation gauge Personal Consumption Expenditures.
· Housing information will come from Pending Home Sales on Monday and the S&P/Case-Shiller Home Price Index on Tuesday.
· From the manufacturing sector, Chicago PMI will be delivered on Tuesday followed by the ISM Index on Wednesday.
· Labor market news will be plentiful with the ADP National Employment Report on Wednesday, worker Productivity and weekly Initial Jobless Claims on Thursday. The January Jobs Report will be released on Friday, which includes Non-farm Payrolls, Hourly Earnings and the Unemployment Rate.
· Also this week, Consumer Confidence will be released on Tuesday, the FOMC Monetary Policy Statement on Wednesday and ISM Services Index on Friday.
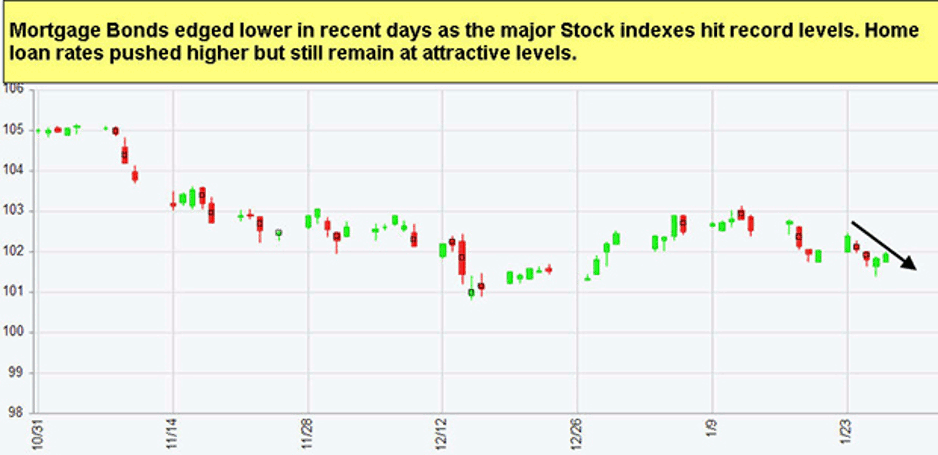
Remember: Weak economic news normally causes money to flow out of Stocks and into Bonds, helping Bonds and home loan rates improve. In contrast, strong economic news normally has the opposite result. The chart below shows Mortgage Backed Securities (MBS), which are the type of Bond on which home loan rates are based.
When you see these Bond prices moving higher, it means home loan rates are improving. When Bond prices are moving lower, home loan rates are getting worse.
To go one step further, a red “candle” means that MBS worsened during the day, while a green “candle” means MBS improved during the day. Depending on how dramatic the changes are on any given day, this can cause rate changes throughout the day, as well as on the rate sheets we start with each morning.
As you can see in the chart below, Mortgage Bonds have been stutter stepping downward since mid-January. Although home loan rates increased slightly, they are still in attractive territory.
Chart: Fannie Mae 3.5%% Mortgage Bond (Jan 27, 2017)
The Mortgage Market Guide View…
How to Fix Errors on Your Credit-Card Bill
Start with the merchant in question, but don’t be afraid to escalate a dispute to your credit card issuer. By Lisa Gerstner, Kiplinger.com
As card statements roll in this post-holiday season, keep your eyes peeled for errors, such as a duplicate charge or one for an item you never received. If you suspect that a thief has used your card, call the issuer right away. Otherwise, many card issuers let you initiate a dispute through their websites. And Citibank customers may now dispute a charge through the bank’s mobile app.
The most efficient way to resolve a billing error may be to ask the merchant to make amends. If you still need to contact the card issuer, be sure to put the dispute in writing within 60 days of the time the bill containing the error was sent to you. Doing so triggers your protections under the Fair Credit Billing Act — although major card networks often honor disputes for at least twice that long, says Sean McQuay of NerdWallet.
While your case is under investigation, you won’t have to pay the charge or any interest that accumulates on it, and the issuer can’t report you as delinquent to the credit bureaus. If you want to be sure of a paper trail to back up your dispute, send a letter by certified mail and request a return receipt, says Chi Chi Wu, staff lawyer for the National Consumer Law Center. The creditor has to settle your case within two billing cycles (and no longer than 90 days) of receiving the notice.
If the card company decides in your favor, you’re home free. But if the issuer finds no mistake — say, the charge is a legitimate one whose label you didn’t recognize — you’ll have to pay up. Still feel as if you’ve been wronged? File a complaint with the Consumer Financial Protection Bureau, at www.consumerfinance.gov/complaint. It will forward your complaint to the issuer, which must respond within 15 days.
Economic Calendar for the Week of January 30 – February 03
| Date | ET | Economic Report | For | Estimate | Actual | Prior | Impact |
|---|---|---|---|---|---|---|---|
| Mon. January 30 | 08:30 | Personal Income | Dec | NA | 0.0% | Moderate | |
| Mon. January 30 | 08:30 | Personal Spending | Dec | NA | 0.2% | Moderate | |
| Mon. January 30 | 08:30 | Personal Consumption Expenditures and Core PCE | Dec | NA | 0.0% | HIGH | |
| Mon. January 30 | 08:30 | Personal Consumption Expenditures and Core PCE | YOY | NA | 1.6% | HIGH | |
| Mon. January 30 | 10:00 | Pending Home Sales | Dec | NA | -2.5% | Moderate | |
| Tue. January 31 | 10:00 | Consumer Confidence | Jan | NA | 113.7 | Moderate | |
| Tue. January 31 | 09:45 | Chicago PMI | Jan | NA | 54.6 | Moderate | |
| Tue. January 31 | 09:00 | S&P/Case-Shiller Home Price Index | Nov | NA | 5.1% | Moderate | |
| Tue. January 31 | 08:30 | Employment Cost Index (ECI) | Q4 | NA | 0.6% | HIGH | |
| Wed. February 01 | 02:00 | FOMC Meeting | Feb | NA | 0.625% | HIGH | |
| Wed. February 01 | 10:00 | ISM Index | Jan | NA | 54.7 | HIGH | |
| Wed. February 01 | 08:15 | ADP National Employment Report | Jan | NA | 153K | HIGH | |
| Thu. February 02 | 08:30 | Jobless Claims (Initial) | 1/28 | NA | 259K | Moderate | |
| Thu. February 02 | 08:30 | Productivity | Q4 | NA | 3.1% | Moderate | |
| Fri. February 03 | 10:00 | ISM Services Index | Jan | NA | 57.2 | Moderate | |
| Fri. February 03 | 08:30 | Non-farm Payrolls | Jan | NA | 156K | HIGH | |
| Fri. February 03 | 08:30 | Hourly Earnings | Jan | NA | 0.4% | HIGH | |
| Fri. February 03 | 08:30 | Unemployment Rate | Jan | NA | 4.7% | HIGH | |
| Fri. February 03 | 08:30 | Average Work Week | Jan | NA | 34.3 | HIGH |