Retail Sales Weak. Inflation Tame.
Last Week in Review:
“Just shopping. Not buying anything.” The Dramatics. Consumers are spending more than last year, but sales from month to month don’t register consistently.
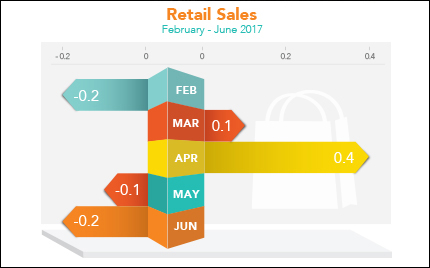 June Retail Sales fell 0.2 percent from May, the second monthly decrease in a row, though they were 2.8 percent above June 2016 per the Commerce Department. Spending at department stores, food stores and gas stations all declined. Total second quarter sales were up 3.8 percent from the same period a year ago. Consumer spending makes up two-thirds of U.S. economic activity.
How high can home prices go? Data analytics firm CoreLogic reported that home prices nationwide rose 6.6 percent from May 2016 to May 2017 and 1.2 percent from April to May of this year. Tight inventories of homes for sale continue to push prices higher in many markets. CoreLogic forecasts indicate that home prices will increase by 5.3 percent on a year-over-year basis from May 2017 to May 2018.
Consumer inflation remained tame in June, with the Consumer Price Index (CPI) unchanged from May, the Bureau of Labor Statistics reported. Core CPI, which excludes volatile food and energy prices, rose 0.1 percent, coming in just below expectations. Over the last 12 months, CPI fell to 1.6 percent from 1.9 percent, the lowest annual number since October 2016, as costs declined further for gasoline and phone services.
Inflation at the wholesale level also remained tame in June, with the Producer Price Index coming in just above expectations at 0.1 percent. An increase in the cost of services was offset by a decrease in energy prices during the month.
Inflation is an important measure to watch because inflationary pressures reduce the value of fixed investments like Mortgage Bonds. This, in turn, can hurt home loan rates.
At this time, home loan rates remain in attractive territory, which can help offset the cost of rising home prices.
Forecast for the Week:
Housing Starts and Building Permits have a lot of ground to cover to make up for May.
-
Regional manufacturing data in the Empire State Index and the Philadelphia Fed Index will be released on Monday and Thursday, respectively.
-
Housing numbers come in the form of the NAHB Housing Market Index on Tuesday, followed by Building Permits and Housing Starts on Wednesday.
-
As usual, weekly Initial Jobless Claims will be released on Thursday.
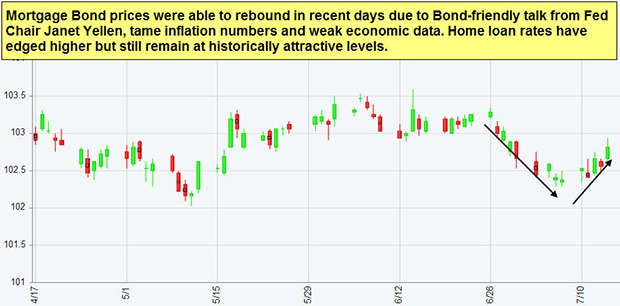
Remember: Weak economic news normally causes money to flow out of Stocks and into Bonds, helping Bonds and home loan rates improve. In contrast, strong economic news normally has the opposite result. The chart below shows Mortgage Backed Securities (MBS), which are the type of Bond on which home loan rates are based.
 When you see these Bond prices moving higher, it means home loan rates are improving. When Bond prices are moving lower, home loan rates are getting worse.
To go one step further, a red “candle” means that MBS worsened during the day, while a green “candle” means MBS improved during the day. Depending on how dramatic the changes are on any given day, this can cause rate changes throughout the day, as well as on the rate sheets we start with each morning.
As you can see in the chart below, Mortgage Bond prices have rallied after dropping below key support levels recently.
Chart: Fannie Mae 3.5%% Mortgage Bond (Jul 14, 2017)
Source: MMG Weekly